Dashboards for automotive business
The automotive sector has been accelerating its digital transformation – and since 2022, Brandfinity has been at the heart of its journey. By building a dedicated vertical for the automotive industry, they have helped different brands like Triumph Motorcycles Switzerland, France, Ducati, Harley-Davidson strengthen their market presence, boost conversions, bring more visitors to their open house events and more importantly, generate more test rides.
The results prove efficiency.
In fact, Brandfinity can pronounce it loudly, as all the metrics speak for themselves. One data point can be read differently from the quality and logic of the collected summary, presented in the reporting.
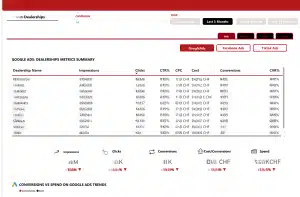
Thus, Brandfinity focused on data-driven dashboards and automotive brands/dealerships’ needs so that they could gain deeper insights and a better understanding.
Finally, their collaboration spans 20 dealerships across Switzerland and France, targeting French, German, and Italian-speaking regions.
The results prove efficiency.
Problematic for the automotive business
Analysing different automotive brands’ pain points, Brandfinity concluded that the most significant challenge brands/dealerships face is the lack of digital marketing talent to translate raw data into actionable insights. Too many channels, too much data, and too many different tools, which are not connected. As a result these elements present considerable complexity in reading the insights correctly and making the proper summary analysis.
Turn challenges into strengths
not just data – real growth-driving results
Considering these weak points, Brandfinity turned these challenges into strengths. They created live-time interactive dashboards adapted to the brand/dealership needs. In addition, they considered the user access profile, whether a global brand manager/a CEO or a marketing manager from the selected dealership.
Subsequently, they devised a solution by give data ownership, simplify, and structure the performance results in digestible brand-focused dashboards powered by Funnel and Power BI solutions.
Solution: Custom-made dashboards
measurable performance results
With Brandfinity’s custom dashboards, everyone can become the reporting champion in one click and understand the outcome of their marketing efficiency.
Brandfinity combined advanced analytics tools with strategic expertise to deliver meaningful insights. They deliver custom-created solutions for the brand’s needs, focused on exact KPIs, which are essential for the user level.
The Goal is not only to give a better analytical understanding of brand performance on a global level, but also to compare their brand presence vs. advertising efficiency in different markets, benchmark it with the competition, and better understand performance at the national level ( by region or by dealership).
Also, see what channels are performing the best, where the drop is, what they need to change in the strategy, and which sources to optimise.
Reporting levels
Global vs Dealership view
The dashboards show reporting data for global, national, and dealership-level/region views to help decision makers better understand their international or local activity’s performance.
On the other hand, on the dealership side, it shows essential data related to the own/specific dealership, adapted to their dealership-level needs, and essential KPIs related to their ownship.
Why do you need
custom dashboards for automotive
Unified view of performance
A tailored dashboard consolidates everything into one clear overview.
In addition to the USER LEVEL view (Global vs Dealership), we suggest :
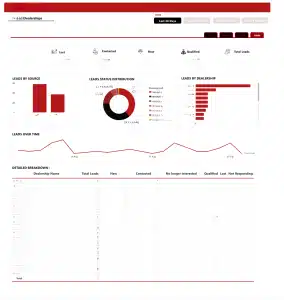
Leads overview
View the qualified leads, New, Lost, Contacted, Leads arrived by source, Leads status distribution, Leads generated by dealership, Detailed breakdown, total leads.
Advertising overview
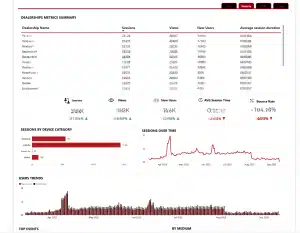
Website overview
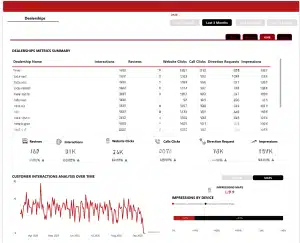
Google My Business overview
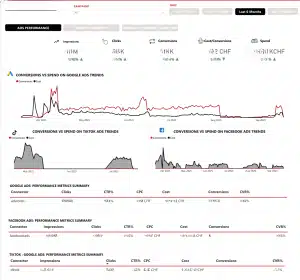
Drill down data from Global to dealership level. Capturing all interactions, calls, itinerary requests, consulting the website pages, clicks, impression map by devices, geography, customer interaction over time, and quantity of reviews over the selected period.
Focus on KPIs which matter
Vanity metrics overwhelm dealerships. They only need visibility on conversions, test ride bookings, lead response time, cost per lead, and after-sales performance.
Better resource, investment allocation
Scalability across multiple dealerships
Briging the digital marketing data analyst gap

In conclusion, dashboards simplify complexity by making insights accessible to sales managers, marketers, and executives alike.
Stay tuned to the latest industry trends. This is precisely where our project comes into its own.
Contact Brandfinity, official Funnel partner.
Why choose Brandfinity?
Trusted partner by industry leaders in the Automotive business and Education
![]() Expertise in Advanced Analytics: Leveraging the latest tools and techniques.
Expertise in Advanced Analytics: Leveraging the latest tools and techniques.![]() Custom Solutions: Tailored strategies for your unique business needs.
Custom Solutions: Tailored strategies for your unique business needs.![]() Actionable Insights: Not just data – real, growth-driving insights.
Actionable Insights: Not just data – real, growth-driving insights.![]() Proven Track Record: Success stories with clients across industries.
Proven Track Record: Success stories with clients across industries.
Success stories
Driving growth with data
Discover how we helped businesses unlock growth through strategic data analytics. View Case Studies
- 1,203 leads in 4 weeks.
- 150+ leads in just the first 2 days.
- Nearly 800 leads by the end of week 2.
- The average dealer generates about 278 monthly leads, so one of the campaigns delivered more than 4 times the typical monthly volume.
- Cost per lead (CPL): €3.97. This outperformed the European automotive and motorcycle benchmark of $25 to $120 per lead by about 85% to 97%.
- The best Conversion rate (link click to lead): 8.37%.
- Impressions and reach were also strong (1.46M impressions and 382k reach)


Recent Comments